Graphing the Process Simulation
Visualizing the simulation flow can confirm whether processes have been configured correctly. The process_graph method provides a graphical representation of all defined processes and their interconnections.
python
# Generate a visualization of the process layout
simulation.process_graph()
The example below corresponds to the configuration described in the Complete Process Example. When executed, it produces an output similar to:
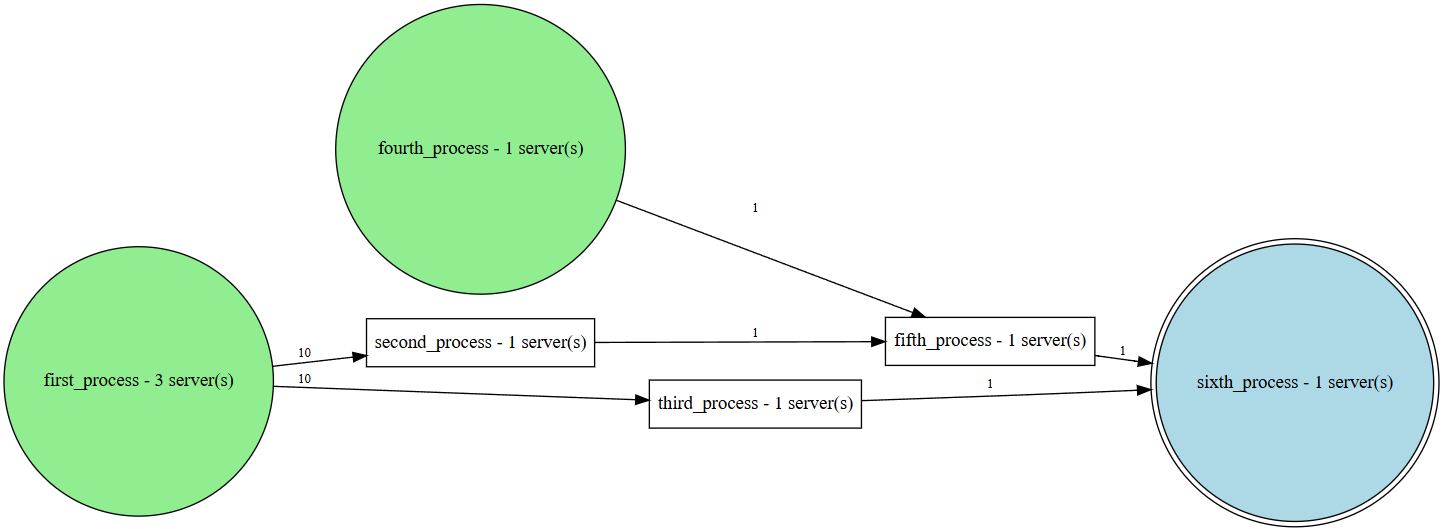
simulate.process_graph()
Additional features are available through the following arguments:
graph_direction (str, optional): Determines the graph’s orientation. Possible values are'LR'(left-to-right) or'TB'(top-to-bottom). Defaults to'LR'.save_graph_pdf (bool, optional): Indicates whether the resulting graph should be saved as a PDF file. Defaults toFalse.
For instance, to generate a top-to-bottom graph and export it as a PDF, include:
python
simulation.process_graph(graph_direction="TB", save_graph_pdf=True)