Empirical Cumulative Distribution Function
The Empirical Cumulative Distribution Function (ECDF) provides a non-parametric estimation of the cumulative distribution of a given dataset. Unlike parametric approaches, the ECDF does not impose assumptions regarding the underlying distribution, allowing for an unbiased representation of the observed data.
Properties
- The ECDF is a non-decreasing function that is bounded within the interval
. - It represents the cumulative probability of observations up to a specified value.
- It is particularly useful for visualizing data distributions, especially in smaller datasets where individual observations significantly influence the overall distribution.
Calculation
For a dataset consisting of
ECDF Plotting
The ECDF can be visualized using the .plot_ecdf() method. This function offers several customizable parameters.
Parameters
plot_title(str, optional): The title of the plot. Default: "ECDF".plot_xaxis_title(str, optional): The label for the horizontal axis. Default: "Domain".plot_yaxis_title(str, optional): The label for the vertical axis. Default: "Cumulative Distribution Function".plot_xaxis_range(tuple[float, float], optional): The range of values for the horizontal axis. If not specified, the range adjusts automatically to the data.plot_xaxis_margin(float, optional): The margin applied around the data domain. Default:0.3.plot_legend_title(str or None, optional): The title of the legend. IfNone, no legend title is displayed.plot_height(int, optional): The height of the plot in pixels. Default:400.plot_width(int, optional): The width of the plot in pixels. Default:400.plot_line_color(str, optional): The color of the ECDF line, specified in RGBA format.plot_line_width(int, optional): The thickness of the ECDF line. Default:2.plot_line_name(str, optional): The label for the ECDF in the plot legend. Default: "Empirical Distribution".plotly_plot_renderer("png" | "jpeg" | "svg" | None, optional): The output format when using Plotly as the rendering engine. Default:None, which uses the default renderer.plot_engine("plotly" | "matplotlib", optional): Specifies the plotting library to be used. Default: "plotly".
Default Usage
For a basic implementation without additional customization, the ECDF plot can be generated as follows:
phi.plot_ecdf()Complete Usage
For a more detailed customization of the ECDF plot, the following implementation demonstrates the use of multiple parameters:
phi.plot_ecdf(
    plot_title="Empirical CDF of Sample Data",
    plot_xaxis_title="Observed Values",
    plot_yaxis_title="Cumulative Probability",
    plot_xaxis_range=(0, 100),
    plot_xaxis_margin=0.2,
    plot_legend_title="ECDF Curve",
    plot_height=600,
    plot_width=800,
    plot_line_color="rgba(255,0,0,0.8)",
    plot_line_width=3,
    plot_line_name="Empirical CDF",
    plotly_plot_renderer="png",
    plot_engine="plotly"
)
Example Visualization
The following figure provides an example of an ECDF plot generated using the .plot_ecdf() method.
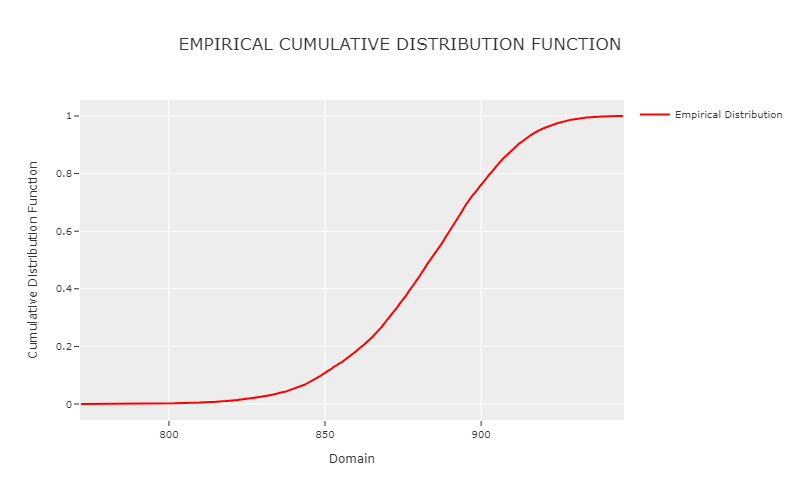
For further details on additional functionalities and extended capabilities, refer to the subsequent sections of this documentation.