ECDF vs. Theoretical Distribution
The Empirical Cumulative Distribution Function (ECDF) is a statistical tool used to estimate the cumulative probability distribution of an observed dataset. It provides a stepwise function that indicates the proportion of data points less than or equal to a specific value.
Key Characteristics
- The ECDF explicitly represents individual data points, distinguishing it from histograms, which aggregate data into bins.
- It is a non-decreasing function constrained within the range
. - It is particularly useful for examining distributional characteristics in small-to-medium-sized datasets.
Mathematical Definition
Given a dataset of
Each step in the ECDF plot corresponds to a unique data point within the dataset.
Comparison with a Theoretical Distribution
To compare the ECDF of an empirical dataset with the cumulative distribution function (CDF) of a fitted theoretical distribution, the method .plot_ecdf_distribution() is utilized. The parameters for this method are detailed below.
Parameters
General Parameters
id_distribution(str): Identifier of the theoretical distribution against which the empirical data is compared. A full list of available distributions can be found in the distributions documentation.plot_title(str, optional): Title of the plot. Default is"ECDF".plot_xaxis_title(str, optional): Label for the x-axis. Default is"Domain".plot_yaxis_title(str, optional): Label for the y-axis. Default is"Cumulative Distribution Function".plot_xaxis_min_offset(float, optional): Offset from the minimum domain value on the x-axis. Default is0.3.plot_xaxis_max_offset(float, optional): Offset from the maximum domain value on the x-axis. Default is0.3.plot_legend_title(str | None, optional): Title for the legend. If set toNone, no title is displayed.plot_height(int, optional): Height of the plot in pixels. Default is400.plot_width(int, optional): Width of the plot in pixels. Default is600.
Empirical Distribution Customization
plot_empirical_line_color(str, optional): Color of the ECDF line in RGBA format. Default is"rgba(128,128,128,1)".plot_empirical_line_width(int, optional): Line width of the ECDF. Default is4.plot_empirical_line_name(str, optional): Legend label for the ECDF. Default is"Empirical Distribution".plot_empirical_bar_color(str, optional): Color of the ECDF bars in RGBA format. Default is"rgba(128,128,128,1)".
Theoretical Distribution Customization
plot_distribution_line_color(str, optional): Color of the theoretical distribution line in RGBA format. Default is"rgba(255,0,0,1)".plot_distribution_line_width(int, optional): Line width of the theoretical distribution. Default is2.
Rendering Options
plotly_plot_renderer("png" | "jpeg" | "svg" | None, optional): Export format when using Plotly. IfNone, Plotly's default renderer is used.plot_engine("plotly" | "matplotlib", optional): Specifies the plotting library to use. The default is"plotly".
Default Usage
To generate a basic ECDF plot comparing an empirical dataset to a theoretical distribution, use the following implementation:
phi.plot_ecdf_distribution(id_distribution="weibull")Replace "weibull" with the desired distribution identifier.
Complete Usage Example
For a fully customized ECDF plot with all available parameters, the following implementation can be used:
phi.plot_ecdf_distribution(
id_distribution="normal",
plot_title="Empirical vs. Theoretical CDF",
plot_xaxis_title="Values",
plot_yaxis_title="Probability",
plot_xaxis_min_offset=0.3,
plot_xaxis_max_offset=0.3,
plot_legend_title="Legend",
plot_height=500,
plot_width=700,
plot_empirical_line_color="rgba(0,128,255,1)",
plot_empirical_line_width=3,
plot_empirical_line_name="Empirical Data",
plot_empirical_bar_color="rgba(0,128,255,0.5)",
plot_distribution_line_color="rgba(255,0,0,1)",
plot_distribution_line_width=2,
plotly_plot_renderer="png",
plot_engine="matplotlib"
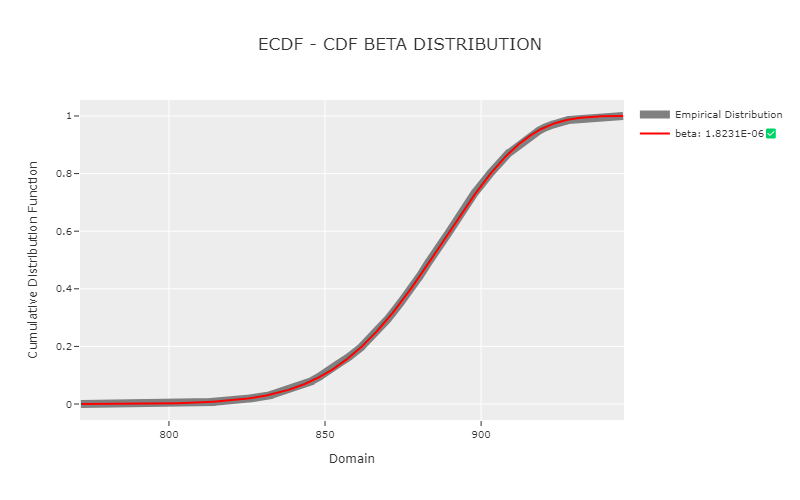
)Example Visualization